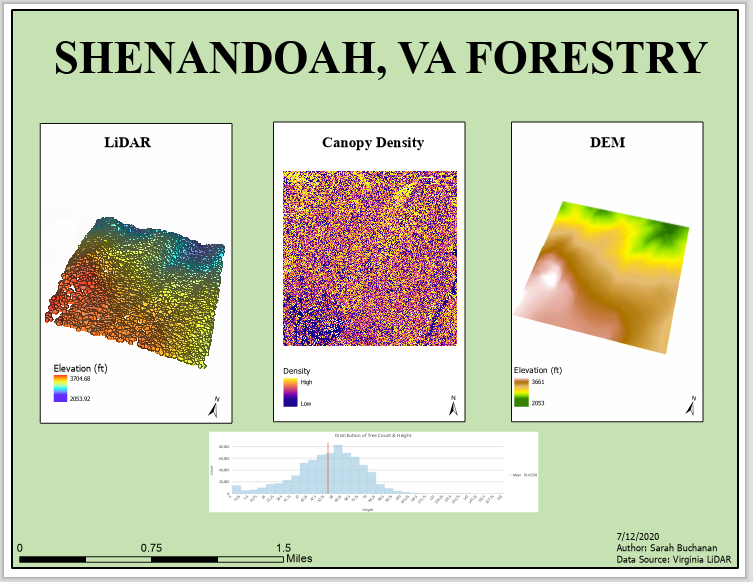
For this week's lab, we learned how to create a DEM and DSM from LiDAR data. The Shenandoah, VA forest area was the region focused on for this assignment. After the DEM and DSM was created, a variety of geoprocessing tools were used to calculate the canopy density and tree height. This was achieved by using the LAS Dataset to Raster for ground points and non-ground points from the LiDAR data to create a DEM and DSM. Then, the minus tool input the DSM followed by the DEM to create the tree height raster. The biomass (canopy) density was constructed through multiple geoprocessing tools. The LAS to Multipoint tool was initiated twice to create a ground and vegetation file. Then these files were created to rasters by using the point to raster tool. Both rasters were input the IS NULL tool to assign the number 1 to every attribute that was not null. The Con Tool was used to identify all zeros as true values and all ones to come from the original raster; this was completed for both ground and vegetation rasters. The Plus Tool combined the ground and vegetation counts and the Float Tool transformed results from integer to float. Finally, the Divide tool set the vegetation count to the float results to return the canopy density.
No comments:
Post a Comment