Thursday, August 6, 2020
Damage Assessment
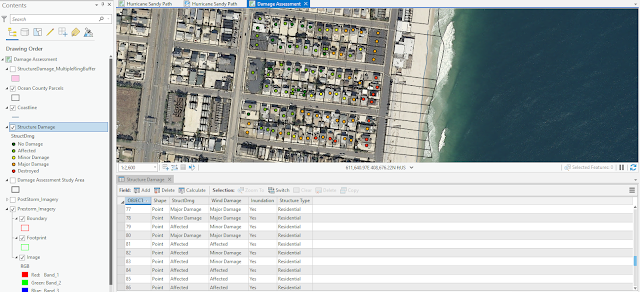
For this week's module, we finished our damage assessment on Hurricane Sandy. We were tasked with categorizing and counting the amount of structure damage caused to buildings in a study area in Ocean County, NJ. This was done by analyzing a pre-storm aerial and a post-storm aerial to determine the amount of damage that occurred in accordance to distance from the shoreline. It was simple to determine homes with major damage or destroyed but it was much trickier to discern between minor damage, affected, and no damage without having the benefit of street view images. A county parcel was used to ensure a structure was digitized in every parcel. After the attributes for the storm damage were added, I changed the symbology to unique values to assign a continuous color ramp to the symbols with labels. To determine the type and number of structural damage caused every 100 meters from the storm, I used the Multi Ring Buffer geoprocessing tool. Fortunately, every building fit entirely inside a buffer ring. This part of the analysis showed that the amount of damage decreased every 100 meters.
Subscribe to:
Post Comments (Atom)


No comments:
Post a Comment